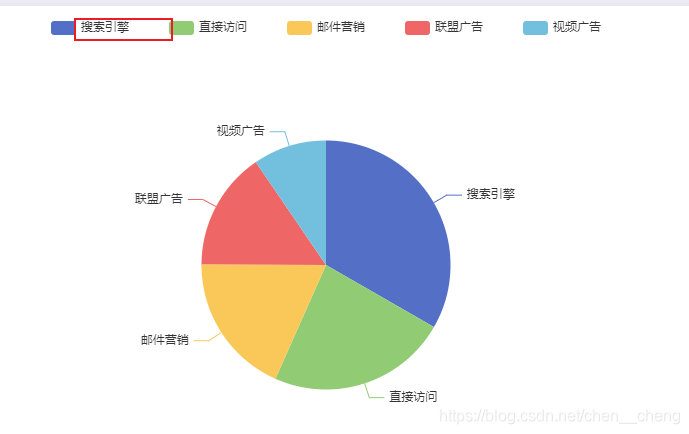
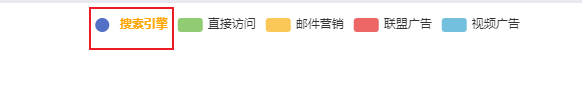
Echarts的legend属性是对图例组件的相关配置
而legend就是Echarts图表中对图形的解释部分:
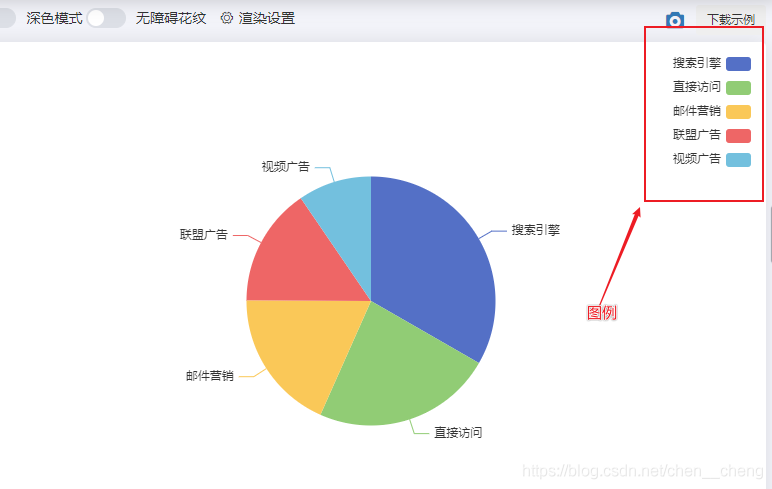
其中legend自身常用的配置属性如下:
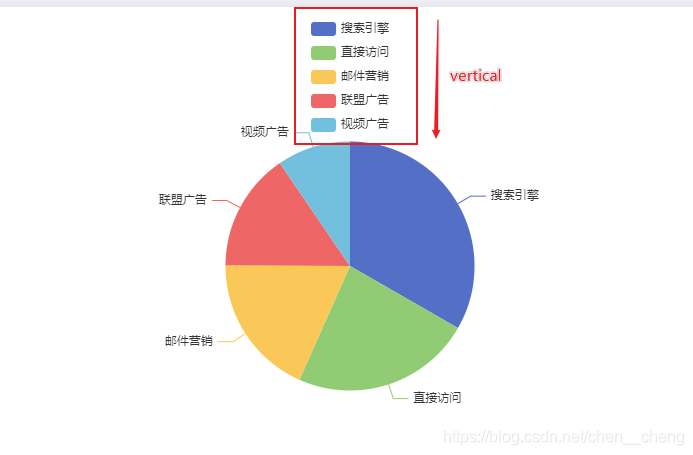
orient
设置图例的朝向
属性值:
vertical // 垂直显示
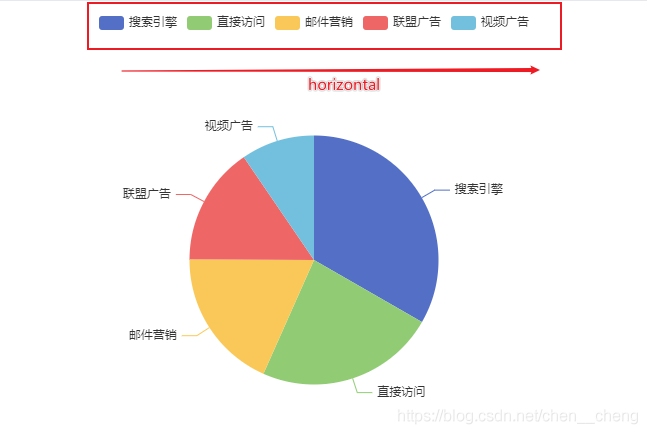
或者
horizontal // 水平显示
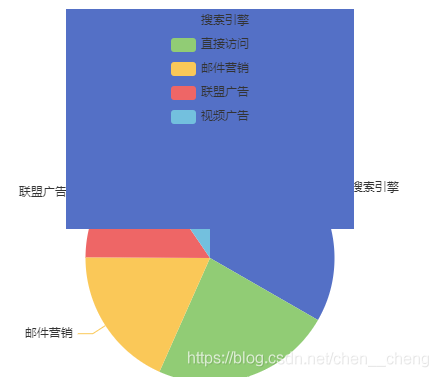
legend: {
        orient: 'vertical'
    }
	legend: {
        orient: 'horizontal'
    }
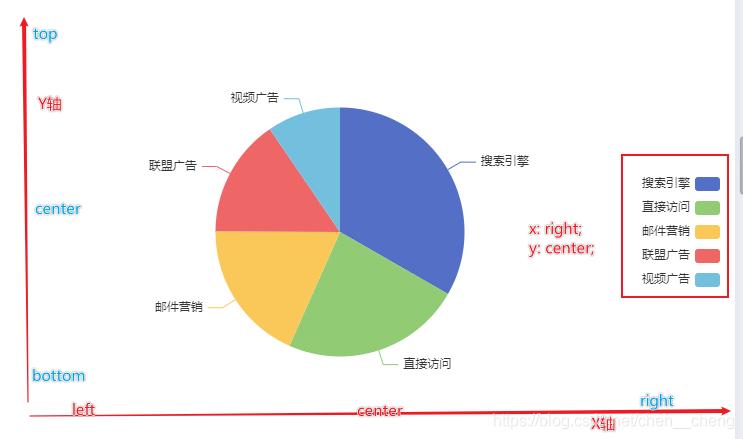
x/y(left/top)
设置图例在X轴方向上的位置以及在Y轴方向上的位置
| 位置 | 取值 |
|---|---|
| x/left | left/center/right |
| y /top | top/center/bottom |
例子:
legend: {
        orient: 'vertical',
        x:'right',
        y:'center'
    }
样式设置
| 属性 | 说明 |
|---|---|
| backgroundColor | 背景颜色 |
| borderColor | 边框颜色 |
| borderWidth | 边框宽度 |
| padding | 内边距 |
注意:边框宽度和内边距属性值为数值,不加单位。
legend: {
        orient: 'vertical',
        x:'center',
        y:'top',
        backgroundColor: '#fac858',
        borderColor: '#5470c6',
        borderWidth: '200',
    }
itemGap
控制每一项的间距,也就是图例之间的距离属性值为数值,不带单位
legend: {
        orient: 'horizontal',
        x:'center',
        y:'top',
        itemGap: 40
    }
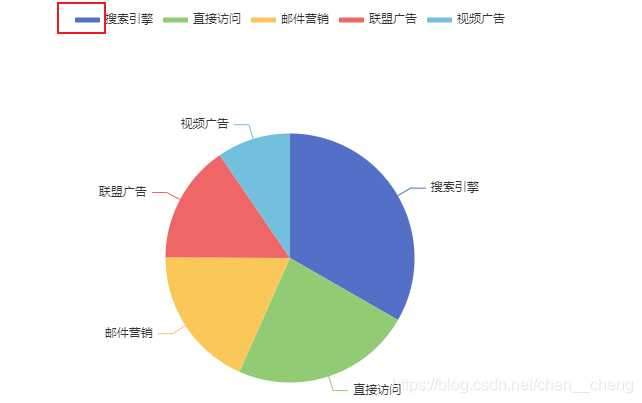
itemHeight
控制图例图形的高度属性值为数字,不加单位
legend: {
        orient: 'horizontal',
        x:'center',
        y:'top',
        itemHeight: 5
    }
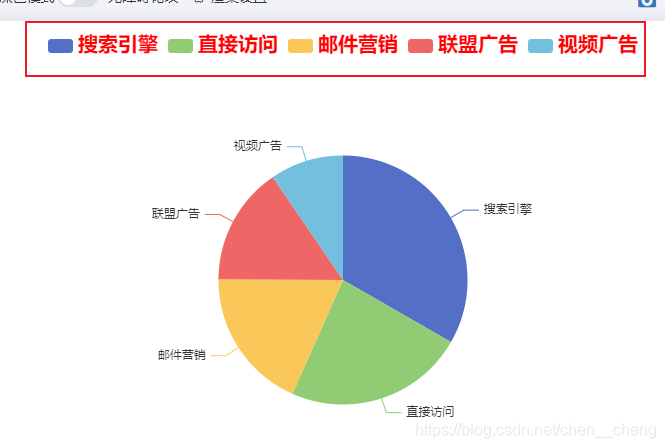
textStyle
设置图例文字样式属性值为一个对象
legend: {
        orient: 'horizontal',
        x:'center',
        y:'top',
        textStyle: {
            color: 'red',
            fontSize: '20px',
            fontWeight: 700
        }
    }
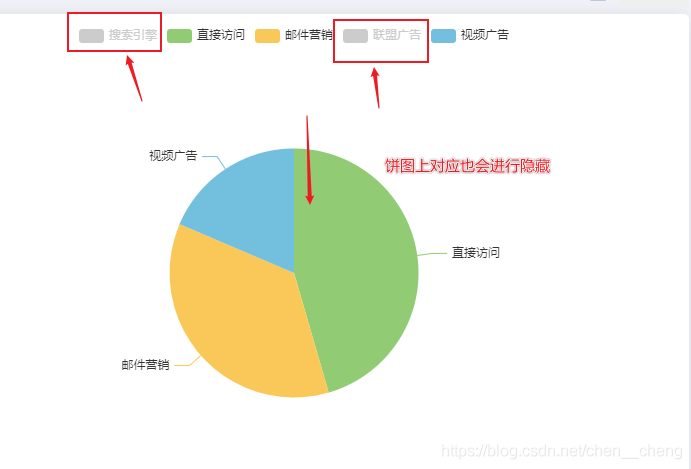
selected
设置图例的某个选项的数据默认是显示还是隐藏。
false: 隐藏
属性值:对象,属性值内容:图例上的数据与boolean构成键值对
如果某选项设置为false,那么图标上的数据也会默认不显示,而图例会以灰色样式显示
legend: {
        orient: 'horizontal',
        x:'center',
        y:'top',
        selected:{
          '搜索引擎': false,
          '联盟广告': false
        }
    }
data
图例上显示的文字信息,如果不设置该项,默认会以series设置的信息作为图例信息。如果设置该项,必须与series设置的信息一致,才会生效。
而该属性的作用:可以单独对图例中某个选项进行单独设置样式
比如:
legend: {
        orient: 'horizontal',
        x:'center',
        y:'top',
        data:[{
        name: '搜索引擎',
        icon: 'circle',
        textStyle: {fontWeight: 'bold', color: 'orange'}
    },'直接访问','邮件营销','联盟广告','视频广告']
    }
以上单独设置中
name:指定该项的名称,必填
icon:指定图例项的icon,可以为内置的图形7个图形,或者自定义图标的形式:'image://url'
textStyle::设置文本样式
补充:自定义legend属性
legend: [{
                        itemWidth: 26,
                        data: [{
                            name: nowIndex.name,
                            icon: "rect"
                        }],
                        left: "0",
                        itemHeight: 6,
                        textStyle: {
                            fontSize: 12,
                            color: "#333",
                            padding: [0, 0,-3, 0], // 修改文字和图标距离
                        },
                    },
                    {
                        itemWidth: 26,
                        data: [{
                            name: oldIndex.name,
                            icon: "rect"
                        }],
                        left: "35%",
                        itemHeight: 6,
                        textStyle: {
                            fontSize: 12,
                            color: "#333",
                            padding: [0, 0,-3, 0], // 修改文字和图标距离
                        },
                    },
                    {
                        itemWidth: 26,
                        data: [{
                            name: danger.name,
                            icon: "roundRect"
                        }],
                        right: "0",
                        itemHeight: 6,
                        textStyle: {
                            fontSize: 12,
                            color: "#333",
                            padding: [0, 0,-3, 0], // 修改文字和图标距离
                        },
                    }
                ],
实现效果

总结
到此这篇关于Echarts中legend属性使用的文章就介绍到这了,更多相关Echarts legend属性使用内容请搜索Devmax以前的文章或继续浏览下面的相关文章希望大家以后多多支持Devmax!