1.直方图
# -*-coding:utf-8 -*-
# @Time :  21:02
# @Author: 黄荣津
# @File : 1.直方图.py
# @Software: PyCharm

from pyecharts.charts import *
from pyecharts.components import Table
from pyecharts import options as opts
from pyecharts.commons.utils import JsCode
import random
import datetime
from pyecharts.globals import CurrentConfig
CurrentConfig.ONLINE_HOST = "https://cdn.kesci.com/lib/pyecharts_assets/"

x_data = ['python', 'java', 'c','c  ', 'R', 'excel']
y_data = [143, 123, 69, 107, 90, 73]
bar = (Bar()
       .add_xaxis(x_data)
       .add_yaxis('', y_data)
      )
bar.render("1.直方图.html")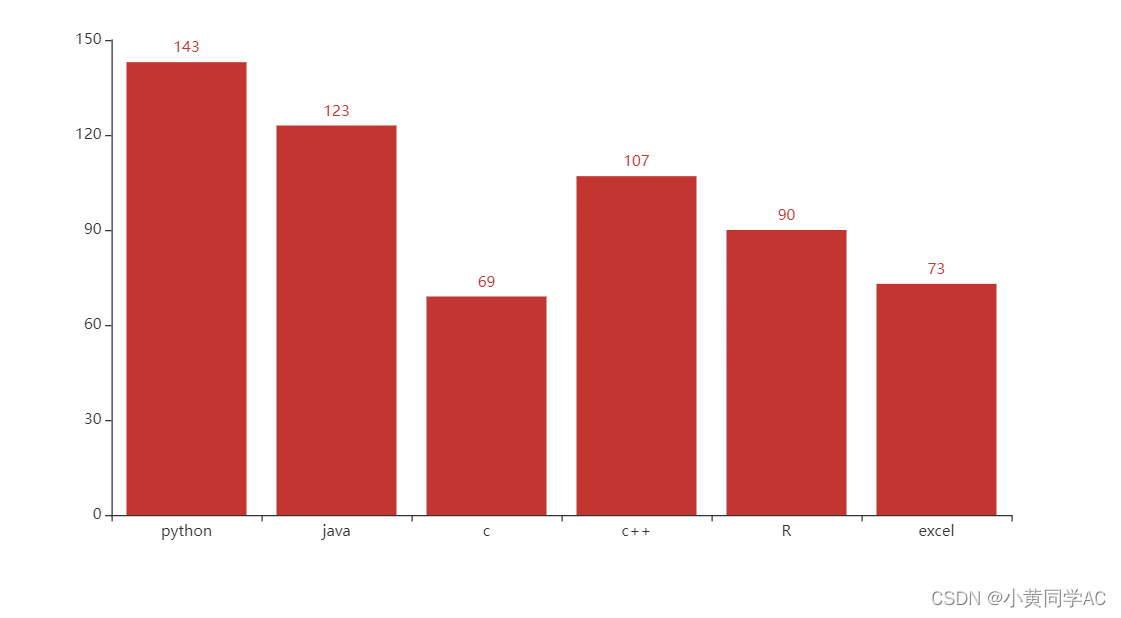
2.折线图
# -*-coding:utf-8 -*-
# @Time :  21:19
# @Author: 黄荣津
# @File : 2.折线图.py
# @Software: PyCharm

from pyecharts.charts import *
from pyecharts.components import Table
from pyecharts import options as opts
from pyecharts.commons.utils import JsCode
import random
import datetime
from pyecharts.globals import CurrentConfig
CurrentConfig.ONLINE_HOST = "https://cdn.kesci.com/lib/pyecharts_assets/"

x_data = ['python', 'java', 'c','c  ', 'R', 'excel']
y_data = [143, 123, 69, 107, 90, 73]
line = (Line()
       .add_xaxis(x_data)
       .add_yaxis('', y_data)
      )
line.render("2.折线图.html")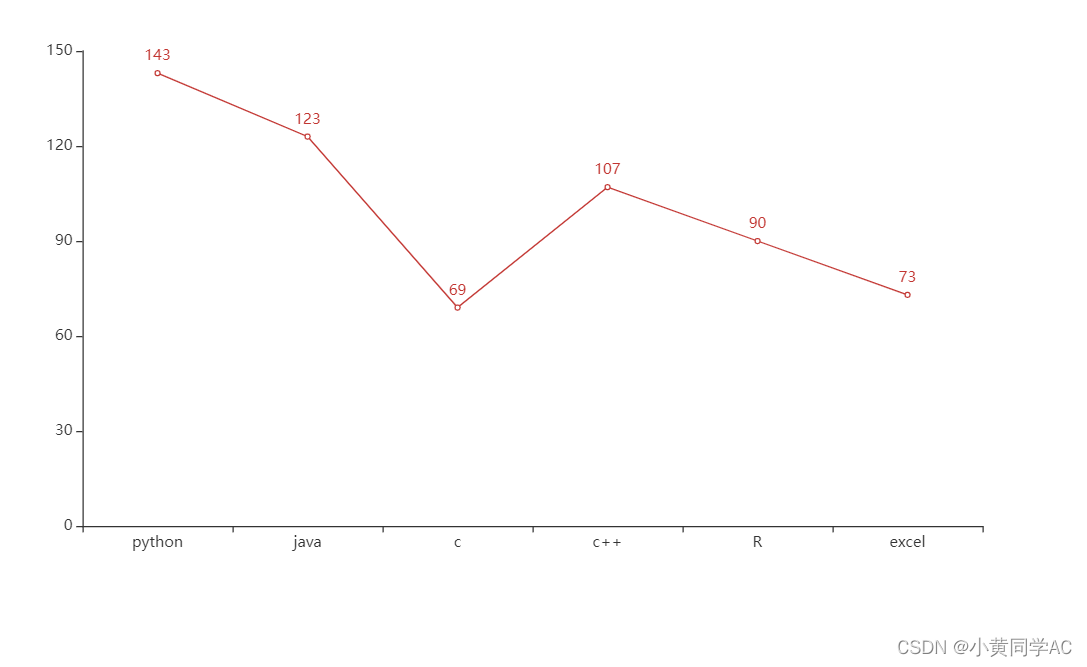
3.箱形图
# -*-coding:utf-8 -*-
# @Time :  21:25
# @Author: 黄荣津
# @File : 3.箱型图.py
# @Software: PyCharm

from pyecharts.charts import *
from pyecharts.components import Table
from pyecharts import options as opts
from pyecharts.commons.utils import JsCode
import random
import datetime
from pyecharts.globals import CurrentConfig
CurrentConfig.ONLINE_HOST = "https://cdn.kesci.com/lib/pyecharts_assets/"

x_data = ['python', 'java', 'c','c  ', 'R', 'excel']
y_data = [[random.randint(100, 150) for i in range(20)] for item in x_data]

class Box:
    pass

box =( Boxplot()
.add_xaxis(x_data)
.add_yaxis("", (y_data))
)
box.render("3.箱型图.html")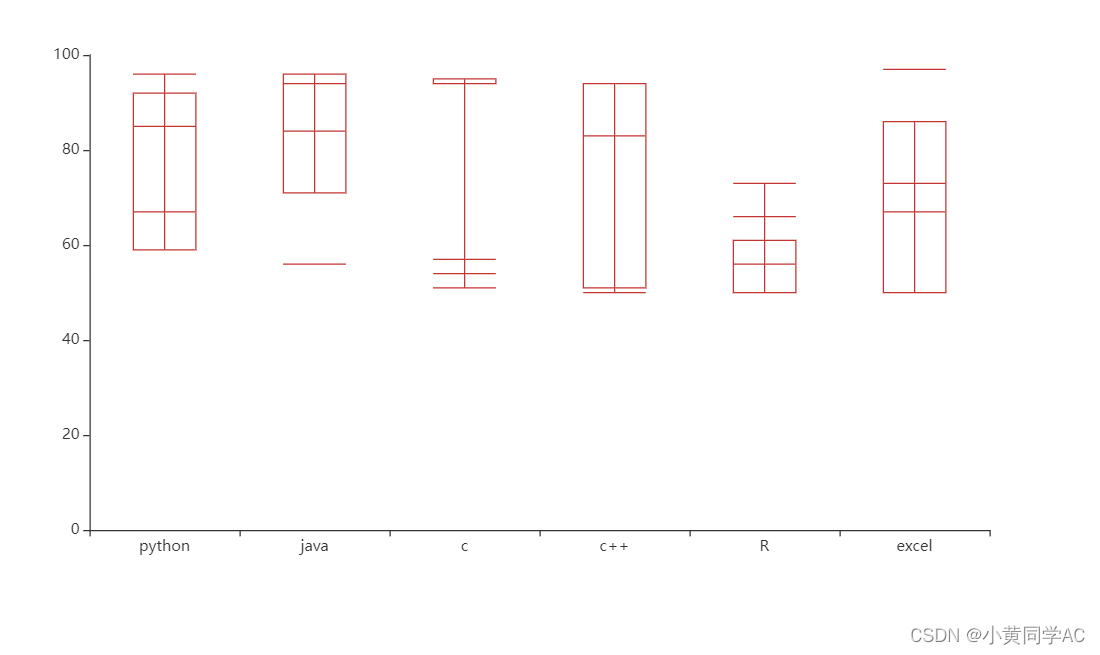
4.散点图
# -*-coding:utf-8 -*-
# @Time :  21:58
# @Author: 黄荣津
# @File : 4.散点图.py
# @Software: PyCharm


from pyecharts.charts import *
from pyecharts.components import Table
from pyecharts import options as opts
from pyecharts.commons.utils import JsCode
import random
import datetime
from pyecharts.globals import CurrentConfig
CurrentConfig.ONLINE_HOST = "https://cdn.kesci.com/lib/pyecharts_assets/"
x_data = ['python', 'java', 'c','c  ', 'R', 'excel']
y_data = [143, 123, 69, 107, 90, 73]
Scatter=(Scatter()
       .add_xaxis(x_data)
       .add_yaxis('', y_data)
      )
Scatter.render("4.散点图.html")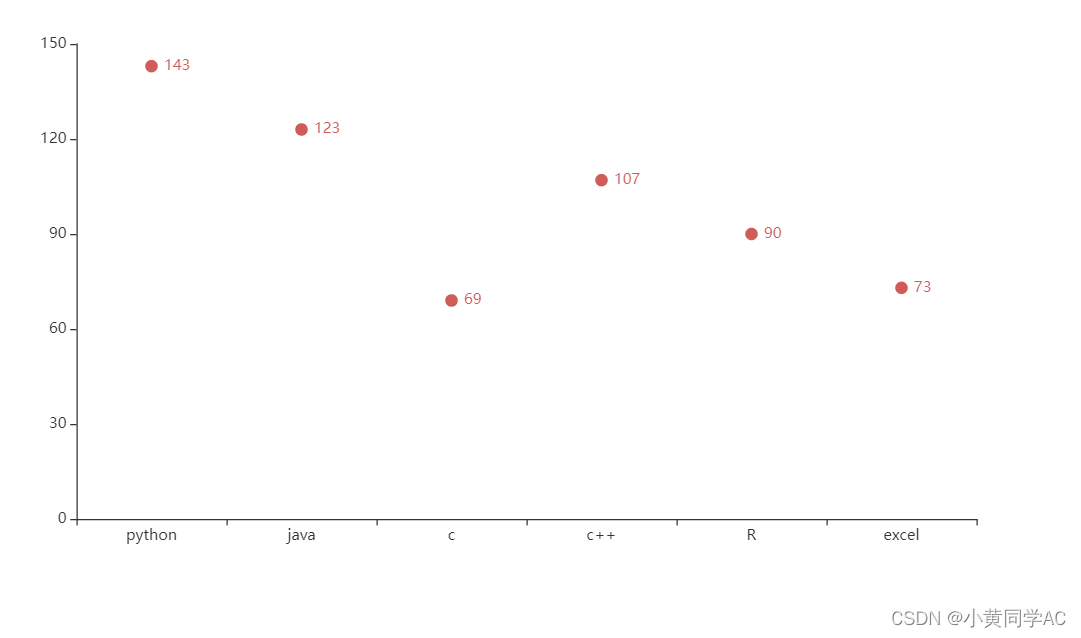
5.带涟漪效果散点图
# -*-coding:utf-8 -*-
# @Time :  22:23
# @Author: 黄荣津
# @File : 5.带涟漪效果散点图.py
# @Software: PyCharm


from pyecharts.charts import *
from pyecharts.components import Table
from pyecharts import options as opts
from pyecharts.commons.utils import JsCode
import random
import datetime
from pyecharts.globals import CurrentConfig
CurrentConfig.ONLINE_HOST = "https://cdn.kesci.com/lib/pyecharts_assets/"
x_data = ['python', 'java', 'c','c  ', 'R', 'excel']
y_data = [143, 123, 69, 107, 90, 73]

effectScatter = (EffectScatter()
           .add_xaxis(x_data)
           .add_yaxis('', y_data)
           )

effectScatter.render("5.带涟漪效果散点图.html")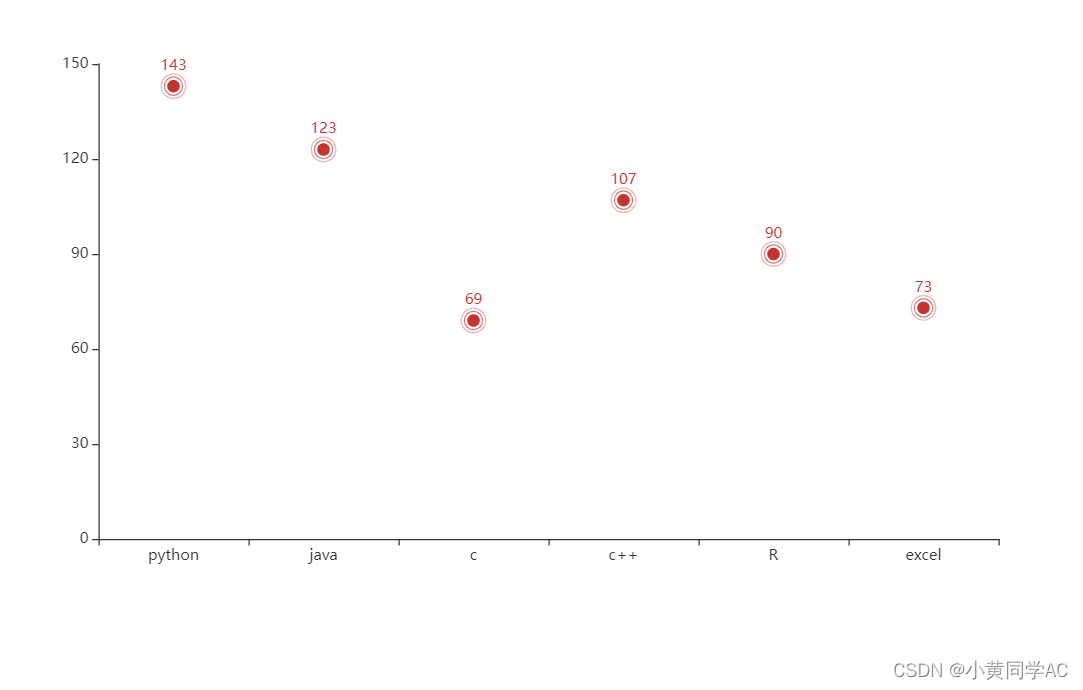
6.k线图
# -*-coding:utf-8 -*-
# @Time :  22:27
# @Author: 黄荣津
# @File : 6.k线图.py
# @Software: PyCharm

from pyecharts.charts import *
from pyecharts.components import Table
from pyecharts import options as opts
from pyecharts.commons.utils import JsCode
import random
import datetime
from pyecharts.globals import CurrentConfig
CurrentConfig.ONLINE_HOST = "https://cdn.kesci.com/lib/pyecharts_assets/"

date_list = ["2022/4/{}".format(i   1) for i in range(30)]
y_data = [[random.randint(200, 350) for i in range(20)] for item in date_list]

kline = (Kline()
         .add_xaxis(date_list)
         .add_yaxis('', y_data)
         )

kline.render("6.k线图.html")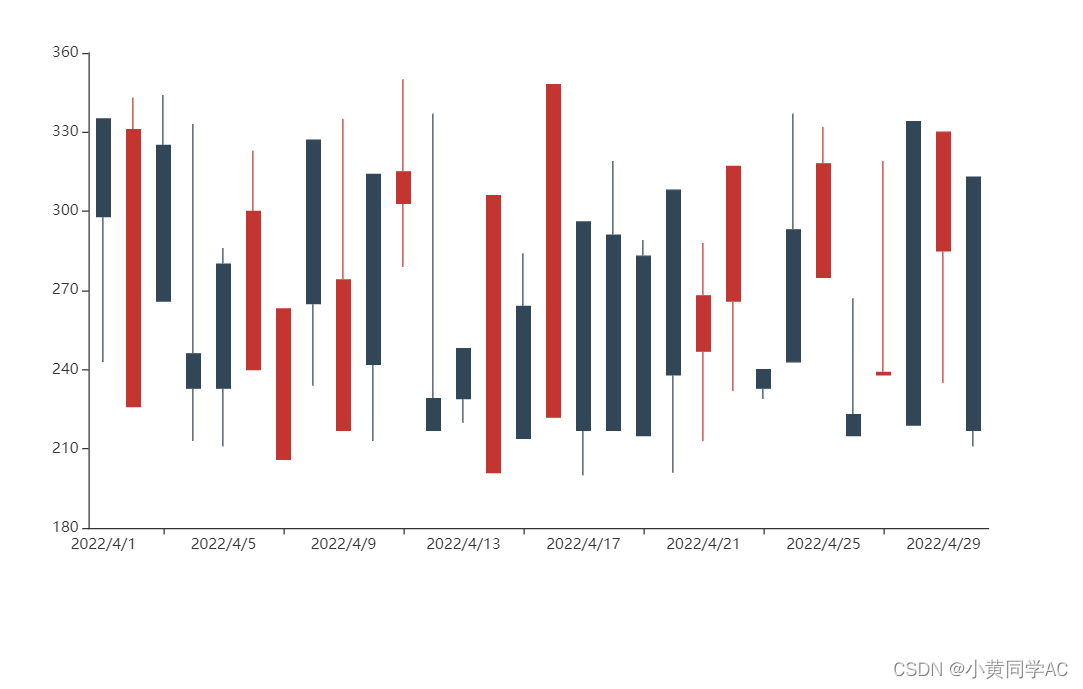
7.热力图
# -*-coding:utf-8 -*-
# @Time :  22:36
# @Author: 黄荣津
# @File : 7.热力图.py
# @Software: PyCharm

from pyecharts.charts import *
from pyecharts.components import Table
from pyecharts import options as opts
from pyecharts.commons.utils import JsCode
import random
import datetime
from pyecharts.globals import CurrentConfig
CurrentConfig.ONLINE_HOST = "https://cdn.kesci.com/lib/pyecharts_assets/"

data = [[i, j, random.randint(0, 100)] for i in range(24) for j in range(7)]
hour_list = [str(i) for i in range(24)]
week_list = ['周日', '周一', '周二', '周三', '周四', '周五', '周六']

heat = (HeatMap()
        .add_xaxis(hour_list)
        .add_yaxis("", week_list, data)
        )

heat.render("7.热力图.html")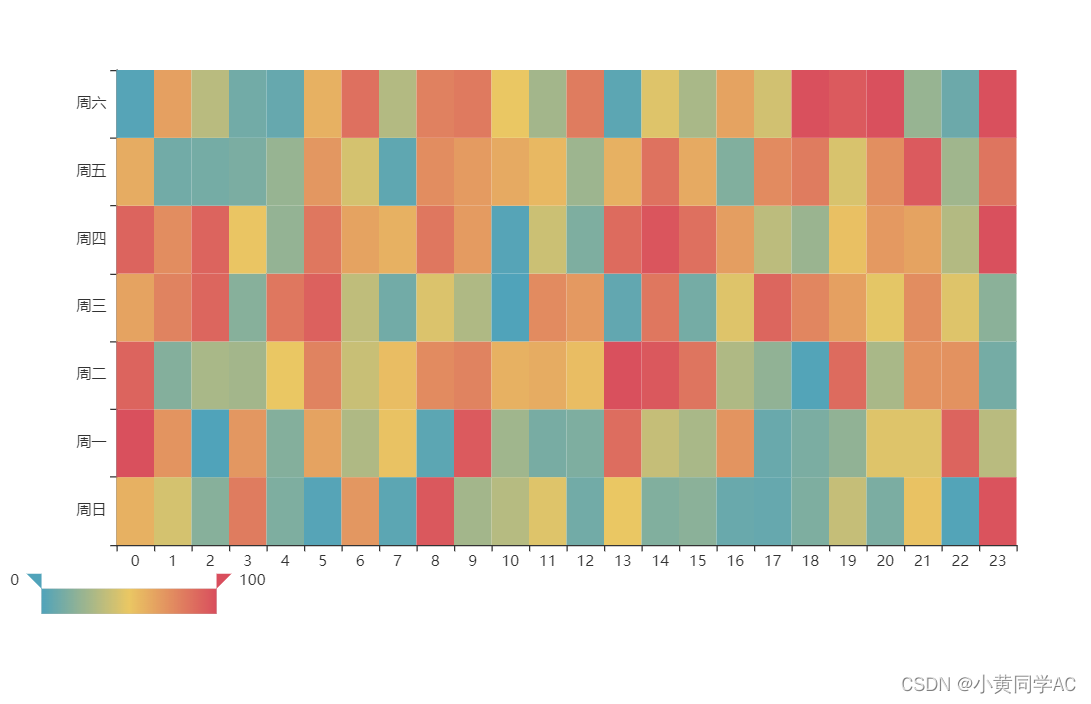
8.象型图
# -*-coding:utf-8 -*-
# @Time :  22:46
# @Author: 黄荣津
# @File : 8.象型图.py
# @Software: PyCharm

from pyecharts.charts import *
from pyecharts.components import Table
from pyecharts import options as opts
from pyecharts.commons.utils import JsCode
import random
import datetime
from pyecharts.globals import CurrentConfig
CurrentConfig.ONLINE_HOST = "https://cdn.kesci.com/lib/pyecharts_assets/"

x_data = ['python', 'java', 'c','c  ', 'R', 'excel']
y_data = [143, 123, 69, 107, 90, 33]
pictorialBar = (PictorialBar()
                .add_xaxis(x_data)
                .add_yaxis('', y_data)
                )

pictorialBar.render("8.象型图.html")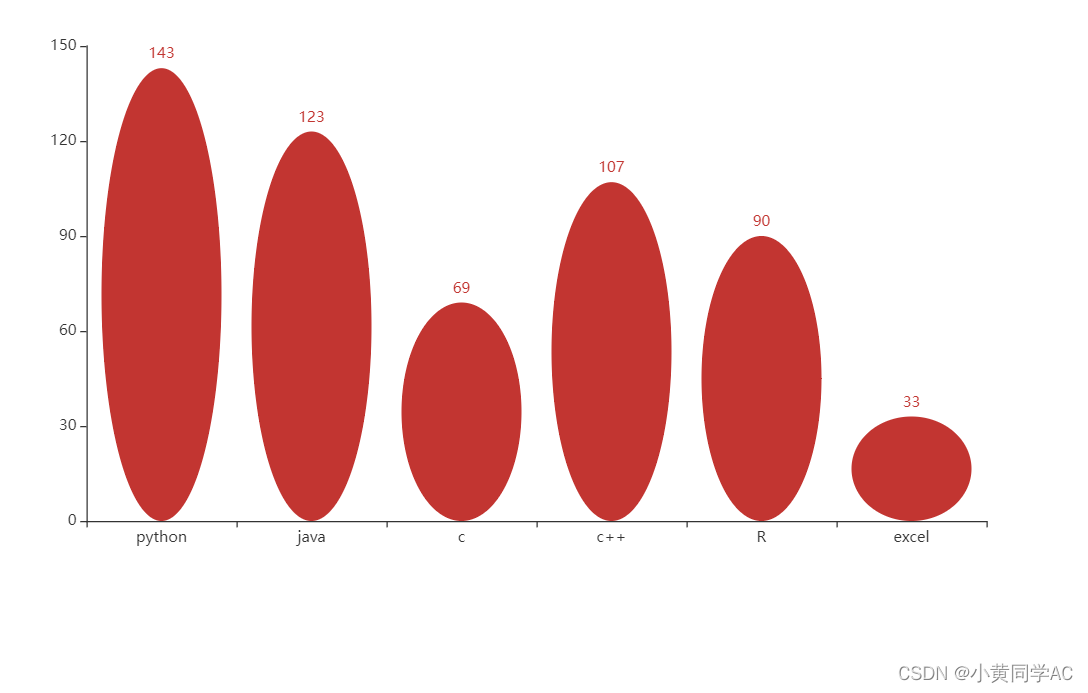
9.层叠图
# -*-coding:utf-8 -*-
# @Time :  23:02
# @Author: 黄荣津
# @File : 9.层叠图.py
# @Software: PyCharm

from pyecharts.charts import *
from pyecharts.components import Table
from pyecharts import options as opts
from pyecharts.commons.utils import JsCode
import random
import datetime
from pyecharts.globals import CurrentConfig
CurrentConfig.ONLINE_HOST = "https://cdn.kesci.com/lib/pyecharts_assets/"

x_data = ['python', 'java', 'c','c  ', 'R', 'excel']
y_data = [143, 123, 69, 107, 90, 73]
bar = (Bar()
       .add_xaxis(x_data)
       .add_yaxis('', y_data)
       )

line = (Line()
        .add_xaxis(x_data)
        .add_yaxis('', y_data)
        )

overlap = bar.overlap(line) #利用第一个图表为基础,往后的数据都将会画在第一个图表上
overlap.render("9.层叠图.html")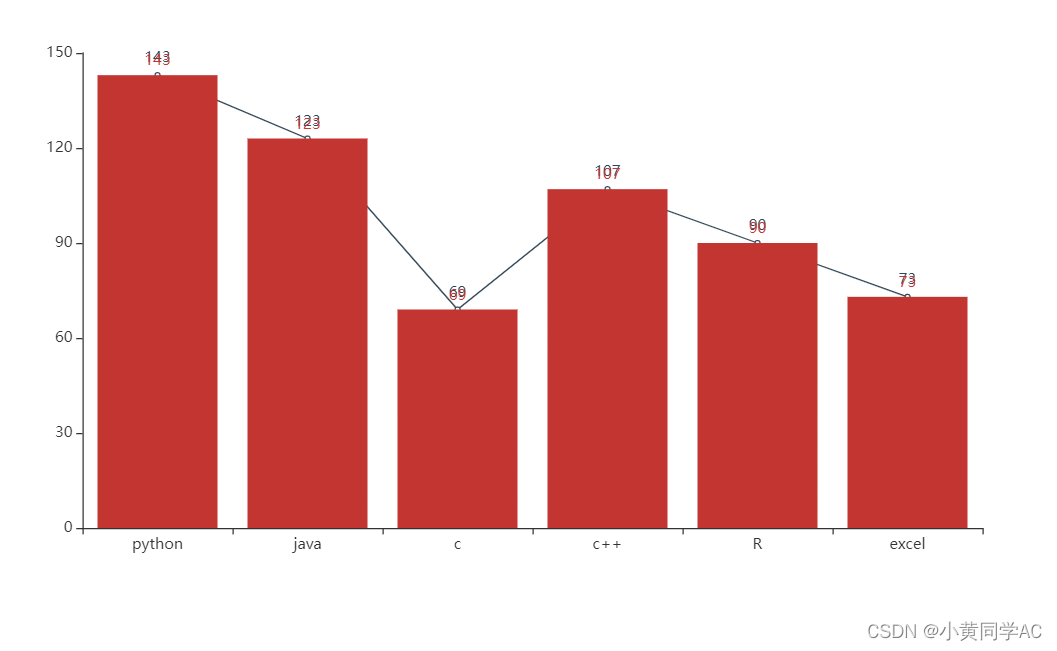
总结
到此这篇关于如何基于Pyecharts绘制常见的直角坐标系图表的文章就介绍到这了,更多相关Pyecharts绘制直角坐标系图表内容请搜索Devmax以前的文章或继续浏览下面的相关文章希望大家以后多多支持Devmax!